
Google calls Lighthouse "an open-source, automated tool for improving the quality of web pages". It is not a performance tool per se, but a prominent feature is giving feedback on a webpage's performance. It is a big challenge to get a top performance score for mobile in Lighthouse. If you have tried to attain a top score in Lighthouse -- it may have made you doubt yourself, the tool, or both! Let's explore Lighthouse to see why this is.
Is Lighthouse misleading, or is it a misunderstanding?
Issue 1 - The scoring scale is not linear
You may think that the performance score is linear where a score of 100 is 10% better than a score of 90, but that is not the case. Actually the score follows a curved distribution, here is the score curve of the Time to Interactive (TTI) metric:
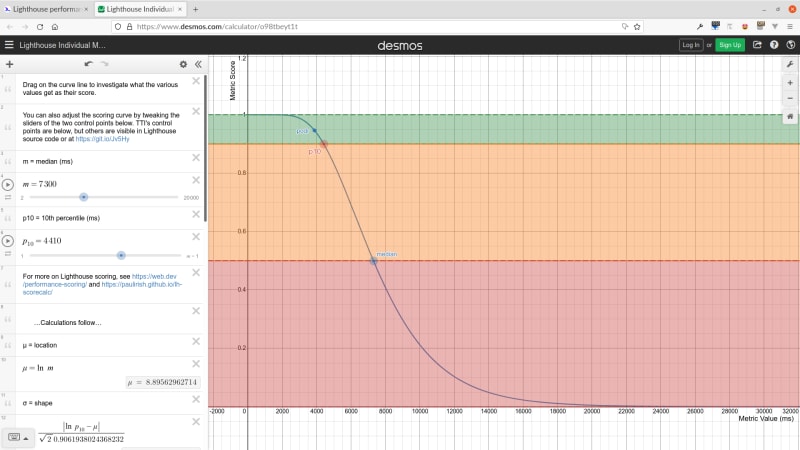
Google mentions this in their docs when they discuss how scores are color coded:
To provide a good user experience, sites should strive to have a good score (90-100). A "perfect" score of 100 is extremely challenging to achieve and not expected. For example, taking a score from 99 to 100 needs about the same amount of metric improvement that would take a 90 to 94.
This characteristic of the calculation of the performance score means that the effort you put in to improve your score will vary depending on where you are on the curve. To make an analogy, it is like a runner putting in equal effort throughout a race:
- Running downhill: the runner will run faster;
- On the flat: the runner will run at their regular pace;
- Uphill: the runner will run slower.
Perhaps, you did not expect this from a scoring system from zero to 100. I didn't! After all the word percent means "one part in a hundred". This misunderstanding could have been mitigated if a different range or distribution was chosen. Maybe, it would trip less people up if they showed the score as a point on the curve for each metric?
You can dig into the details of the scoring algorithm to understand it more deeply.
Issue 2 - Scores can vary a lot
If you run Lighthouse on the same website using the same computer on the same network multiple times, you will get variable results. This feels weird at first. I'm repeating the exact same thing and getting a different result? Is this a bug or a warped reality?
Google says the following on score variability:
A lot of the variability in your overall Performance score and metric values is not due to Lighthouse. When your Performance score fluctuates it's usually because of changes in underlying conditions. Common problems include:
- A/B tests or changes in ads being served
- Internet traffic routing changes
- Testing on different devices, such as a high-performance desktop and a low-performance laptop
- Browser extensions that inject JavaScript and add/modify network requests
- Antivirus software
It is not due to Lighthouse? 🤔 Are we are trying to handcuff lightning here? 😏
How variable can it be?
Take testing on different hardware. The swing can be dramatic. Zach Leatherman discussed this in an article -- The Art of Deception, Lighthouse Score Edition -- running Lighthouse on a Macbook (2012) versus a MacBook Air (M1, 2020) resulted in a 30 point swing! That's a lot.
It appears that you can mitigate the impact of hardware by running Lighthouse through PageSpeed Insights (PSI), Google's web-based user experience tool. I guess this hits a particular set of servers consistently.
Google gives a full list of the technical factors for these variances if you want to get into the nitty gritty.
The advice in Lighthouse's GitHub repo to reduce variability is to "run Lighthouse multiple times and beware of variability before drawing conclusions about a performance-impacting change". Why not build this behaviour into Lighthouse to reduce variability?
WebPageTest is a rival web performance tool and their default behaviour is to give a median performance score based on 3 runs. The WebPageTest team have been critical of the consistency of Lighthouse results. It is possible to run Lighthouse through WebPageTest, and they claim they can provide more consistent results from Lighthouse because they provide a more consistent test environment.
While some variability between tests is to be expected, by providing a consistent test environment for all Lighthouse runs, WebPageTest helps to minimize that variability and provide a realistic and repeatable point of comparison.
They point to Lighthouse's use of simulated throttling as one source of variability that could be mitigated.
By default, Lighthouse uses simulated throttling: the test gets run without throttling, and then Lighthouse simulates what a throttled load might look like based on the unthrottled results.
WebPageTest, on the other hand, uses packet-level throttling for all tests, including Lighthouse tests run through WebPageTest. Because packet-level throttling enables network shaping at the packet-level, it's a far more accurate modeling of real network-conditions (there's a fascinating study by the Lighthouse team about throttling accuracy if you want to wade into the weeds on the topic).
Issue 3 - The vast majority of websites are ranked as not good
Let's go back to 2020, this was when Google made a big change regarding their performance rating -- they introduced the Core Web Vitals. I want to discuss this timeframe because it was the last point where there is clear comparable data between the performance metric set (5 metrics) and the Core Web Vitals (3 metrics). The Core Web Vitals is a subset of the performance metric set.
The Core Web Vitals was introduced as an effort to simplify things. To quote Google:
Site owners should not have to be performance gurus in order to understand the quality of experience they are delivering to their users. The Web Vitals initiative aims to simplify the landscape, and help sites focus on the metrics that matter most, the Core Web Vitals.
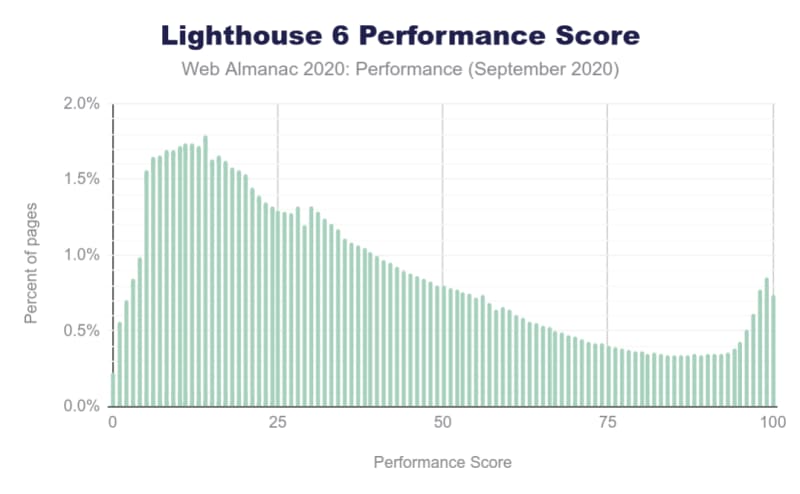
The Web Almanac 2020 edition demonstrated in their performance review of the web that Lighthouse reported 0.7% of websites having a mobile performance score of 100, and 5.7% of websites were in the good category (90-100). Was web performance really that bad? Or is the bar too high?
I was trying to understand how Google picks the good category thresholds and this is their clearest explanation, specifically for the Largest Contentful Paint (LCP) metric:
Based on real website data, top-performing sites render LCP in about 1,220ms, so that metric value is mapped to a score of 99.
Going a bit deeper, the Lighthouse scoring curve model uses HTTPArchive data to determine two control points that then set the shape of a log-normal curve. The 25th percentile of HTTPArchive data becomes a score of 50 (the median control point), and the 8th percentile becomes a score of 90 (the good/green control point).
Does that mean that the upper 8% of the data represents a score of 90 and above? I don't get their explanation to be honest! 😕 Although it sounds about right based on my previous analysis from the Web Almanac.
Barry Pollard did some analysis of Lighthouse scores across the web by querying data on the HTTP Archive in his article, What do Lighthouse Scores look like across the web?, and the results are similiar. He said the following about top level scores:
[..] 90% of sites score 80 or less on Performance or, to put it another way, only 10% of sites score higher than 80 in the Performance category.
It will always be that only a small portion of websites achieve a "good" performance score because it is the upper 8th percentile that make up this category. If web peformance dramatically improved across millions of websites overnight, the bar will be raised and even more is required to get into the "good" category.
Based on the same data (the Chrome User Experience Report data that is available through the HTTP archive) for the same approximate period (August to October 2020), 22.3% of pages passed all 3 Core Web Vital metrics with a "good" score. More websites pass the Core Web Vitals than get a "good" performance score in Lighthouse.
In the subsequent years, refinements to the performance scoring have been made. The latest version of Lighthouse is 10. Five of the same metrics are used in the scoring since version 6, the thresholds and weights have been tweaked. A new metric called Interaction to Next Paint (INP) has been introduced recently and will replace First Input Delay (FID) in March 2024 as a Core Web Vital metric.
What I find strange is that Lighthouse in Chrome's devtools does not mention Core Web Vitals at all. It still gives the performance score on 5 metrics. Why give people the more complex and more challenging set of metrics then?
For defining the thresholds, Google explains the science behind the thresholds related to human perception thresholds and relevant HCI research. The thresholds are based on how we percieve things, but how achievable is that on the web? Google says the following in their article on defining thresholds:
To confirm that a threshold is achievable, we require that at least 10% of origins currently meet the "good" threshold. Additionally, to ensure that well-optimized sites are not misclassified due to variability in field data, we also verify that well-optimized content consistently meets the "good" threshold.
So with all the numbers mentioned, the minimum requirement by Google is that 10% of the web is classified as meeting the "good" performance threshold for the Core Web Vitals. That sounds like the Core Web Vitals are a bit more lenient than the overall performance set, but are still very challenging.
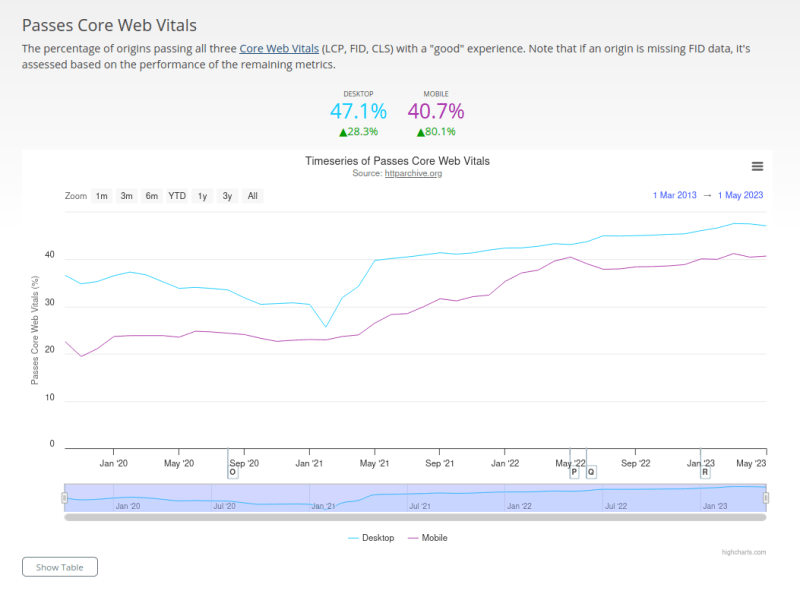
We can see figures for the Core Web Vitals for the last 3 plus years on HTTPArchive, the percentage of origins passing the Core Web Vitals for mobile has increased from 22.6% to 40.7%.
I would love to see the same graph for the overall performance score. My guess is that would be a lot lower.
Issue 4 - Is it field data or lab data?
It is important to understand the difference between lab data and field data. Lighthouse is a lab-based tool, also known as a synthetic tool.
Lab data is collected within a controlled environment with predefined device and network settings. Its main use is for debugging performance issues because it provides a reproducible testing and debugging environment. The downside is that lab data does not capture real-world bottlenecks well.
Field data is performance data collected from real page loads your users are experiencing in the wild. Tools that gather field data are often referred to as Real User Monitoring (RUM) tools. Field data captures true real-world user experience.PageSpeed Insights uses the Chrome User Experience Report (CrUX) dataset to augment lab data provided by Lighthouse for the same metrics. However, your page or origin may not be in the dataset because it is not publicly discoverable or there are not a large enough number of visitors in order to create a statistically significant dataset.
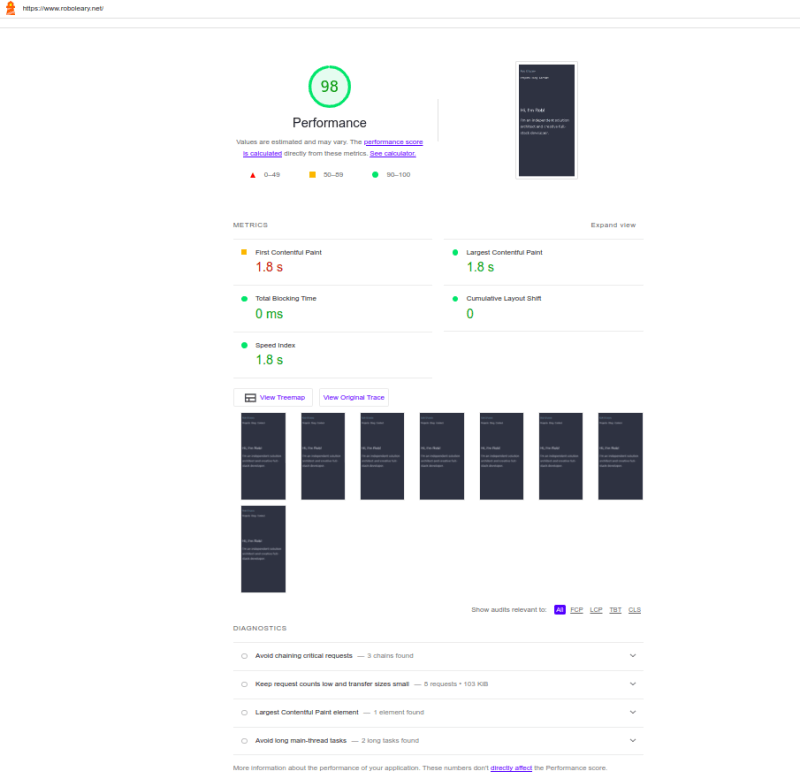
A good example of this dicothomy is to view a PSI report on web.dev, this is Google's blog that has a lot of information on Lighthouse. You can see the result of the very test I ran at this URL: https://pagespeed.web.dev/analysis/https-web-dev/hp4cd34d4i?form_factor=mobile.
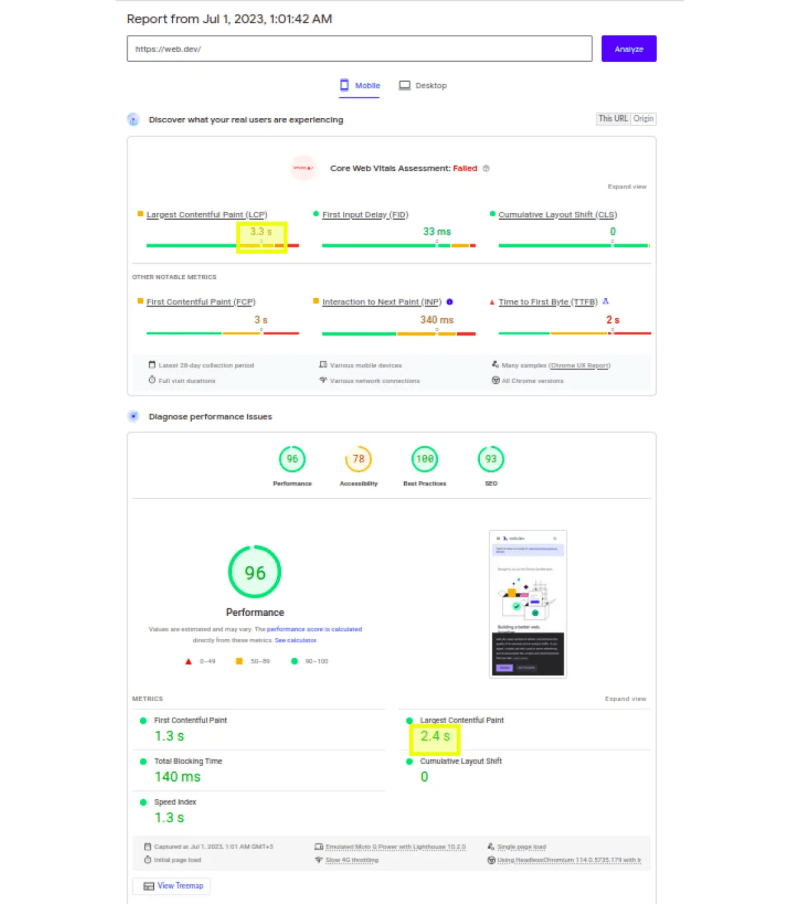
Lighthouse reported a performance score of 96, but it failed the Core Web Vitals! At a glance, it can look like a mistake! How did that happen?
It is because PSI reports different figures for the LCP metric for the Core Web Vitals and the overall performance score (see yellow highlights in screenshot below)! The figures are different because PSI uses field data from the CrUX dataset for the Core Web Vitals (when it is available) in the first section, whereas lab data is used for the performance score in the second section.
You may miss this! Having 2 different metric sets using 2 different datasets side by side was confusing for me initially. Also, if you are focusing on the Core Web Vitals, there are 2 sets based on the testing method:
- Lab testing in Lighthouse: Largest Contentful Paint (LCP), Cumulative Layout Shift (CLS), Total Blocking Time (TBT).
- Field testing in PageSpeed Insights: Largest Contentful Paint (LCP), Cumulative Layout Shift (CLS), First Input Delay (FID).
Previously, the PSI report was more explicit about whether field data or lab data is being used the results shown. Here is an example screenshot of the PSI report from a few years ago:
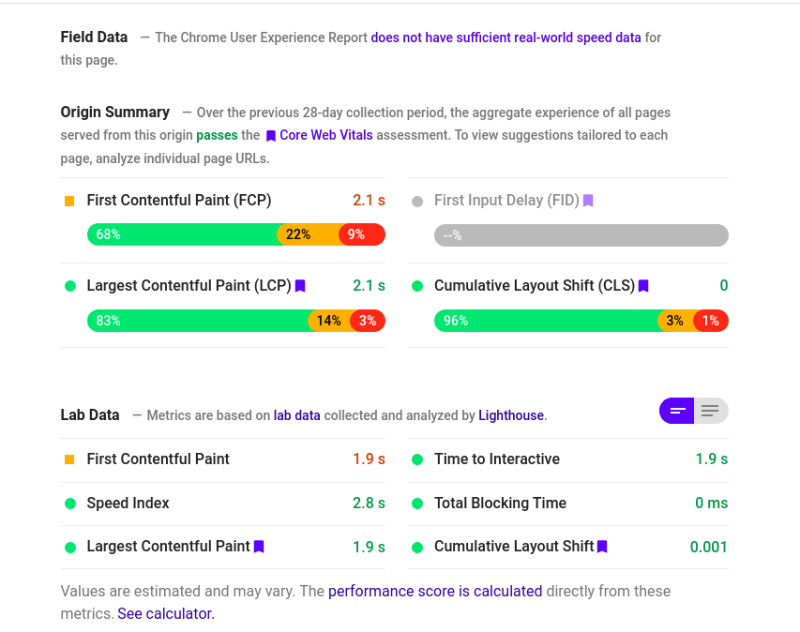
I think that the updates to the UI look prettier but are less apparent.
You can read more about how think of tools in How To Think About Speed Tools by web.dev.
Issue 5 - Mobile or Desktop?
When people discuss and compare Lighthouse scores, often they take screenshots to keep a record. There is no indication in the UI if results are for mobile or desktop. The thresholds for mobile performance are higher. This is avenue for mistakes and misrepresentation.
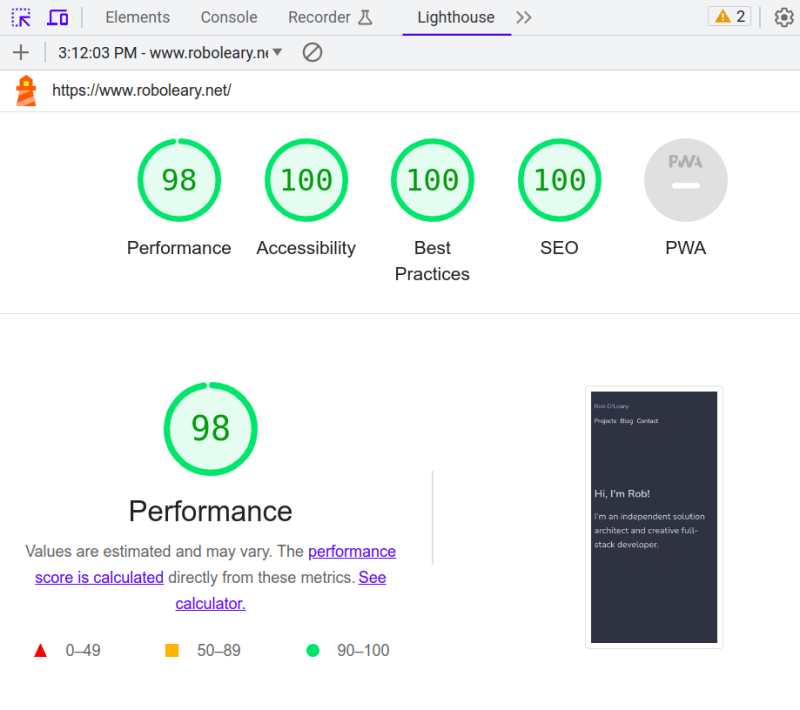
There has been discussion about adding a visual indicator to make the mode more obvious, but it has not made it into Chrome devtools!
Issue 6 - People inevitably aim for near perfect scores
Inevitably, people aim to get a near perfect performance score. People take pride in what they do and want to point to something they made, and say "check out the performance of this". If you build a tool with high thresholds, then you put achieving a top score out of reach for some types of websites and web applications. There is no differentiation between a demanding web store like amazon, a web application like Google Docs, and a personal website.
To highlight this situation, there is a discussion thread, "Instruction to get score 100 on the mobile" on the Lighthouse GithHub repo:
I have used the lighthouse to monitor a website for the performance. However, it's really hard to get 100 score for the mobile. I only can get the score 100 for the mobile with the site that contains only a static text without css, javascript.
I'm not sure if lighthouse team considers that the website contains only a static text is popular nowaday for the modern website.
Of course, the PWA is not standard today yet and even for the PWA, we must load for "full state" mode as well.
I was surprised by this a while back too. I approached rebuilding my personal website by starting with the simplest possible homepage. I had no images, quite a small stylesheet, and I think I used 3 web fonts. It did not get a "good" mobile score! I had to optimize these assets to climb into the 90's.
Another part of this is that when numbers are involved, it can led to a competitive element. Frameworks and libraries lean into this to promote the speed and performance of their offering. Eleventy has a leaderboard that uses a Lighthouse-based plugin called speedlify to rank websites.
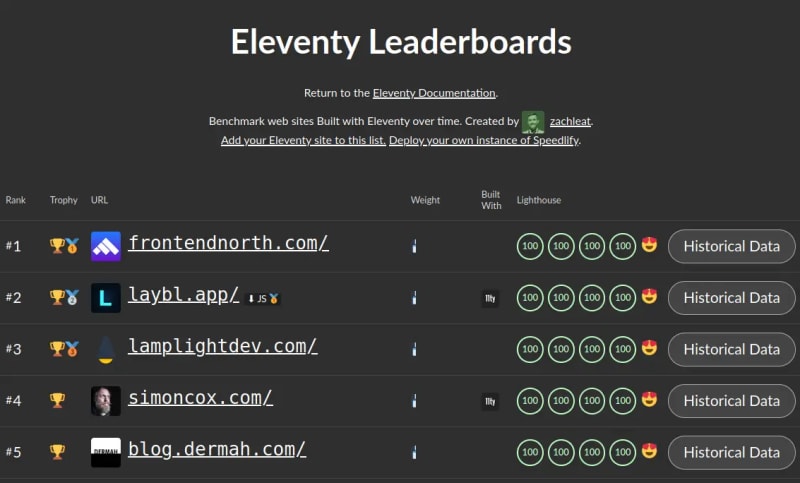
Is Lighthouse suitable for comparing sites in this way? 🤨
Final thoughts
Measuring web performance is a difficult proposition. We are not making homogeneous web-based products in an uniform way. This makes it a challenge to define what is good performance for something on the web. Google has been active in defining what is good performance through its metrics and tools, and has a big say on the matter.
Google calls Lighthouse "an open-source, automated tool for improving the quality of web pages". It inspects a few different facets of a webpage in its audits such as: performance, SEO, and accessibility. It is not a performance auditing tool per se, but it has a big presence in that space because Google made it, put it into Chrome, and announced it that the Core Web Vitals metrics are a factor in their search ranking!
Lighthouse is primarily a lab-based tool that is used for performance debugging. It has some characteristics that are not apparent. The scoring calculation is byzantine, results can be very variable, and it is very difficult to get a "good" performance score for mobile. As I covered in this article, some of it can attributed to the need to understand web performance and Lighthouse fairly well, but in some ways Lighthouse is misleading.
Google says a perfect mobile performance score of 100 is "extremely challenging to achieve". Their approach to performance classification is a lot more stick than carrot. In late 2020, by Lighthouse's classification less than 6% of web origins were deemed to have attained "good" performance, whereas 22.3% passed the Core Web Vital metrics. The Core Web Vital is a more lenient set of metrics.
The Core Web Vitals has made more businesses pay attention to web performance. As the Web Almanac put it in 2022 performance review:
Google’s decision to make CWV [Core Web Vital] part of search ranking catapulted performance to the top of many companies’ roadmaps, especially in the SEO industry. Individual site owners are certainly working hard to improve their performance and played a major role in the CWV improvements over the last year, even if those individual efforts are much harder to spot at this scale.
The percentage of origins passing the Core Web Vitals for mobile at the time of writing is 40.7%.
The aim of the Web Vitals initiative was to simplify the performance landscape, it hasn't done that well in my opinion. There is a lack of clarity and focus. Your performance score is still based on the complete set of metrics. The complete metric set is shown in Chrome's devtools, which is where many people encounter Lighthouse for the first time.
The CWV metrics haven't been embraced fully anywhere really. PSI shows the CWV metrics first, but 3 more metrics sit right alongside them. It does not give a clear message to users - should you be passing CWV or getting a "good" performance score or both? And what is a realistic score for your particular type of application?
Score variability means that Lighthouse comes with caveats. Generally it is not a very reliable performance debugging tool. Since score variability is skewed by your machine's performance when it is run locally, it is probably not a good idea to run Lighthouse in the Chrome's devtools. It is better to use Lighthouse through WebPageTest where it does more to mitigate variability, or use other tools for debugging performance.
I would recommend using Lighthouse primarily to understand how Google classifies your website. The opportunities presented by the Lighthouse audit give you a rough guide to improve performance but take it with a dash of salt. Field data gives you a more realistic view of user experience and you should favour that for understanding the performance of your website.
You can subscribe to my RSS feed to get my latest articles.


