When you measure the database calls from the application, or from the database, you don't see the full picture because they may do something else before logging it. Here is what I use to know exactly how long my queries are active on the database, or on the client. With the simple strace on Linux to time the network roundtrip system calls
I connect as:
yugabyte=>
           \c yugabyte franck

psql (13.7, server 11.2-YB-2.15.0.1-b0)
You are now connected to database "yugabyte" as user "franck".
identification in the client
From the session I can identify the host I'm connected to (because with YugabyteDB you can connect to any node in the cluster) and the PID on that host:
yugabyte=>

 select pg_backend_pid(), current_setting('listen_addresses') host
 , format(
  'postgres: %s %s %s(%s) %s'
  ,usename, datname, client_addr, client_port, state
 ) as cmd
 from pg_stat_activity where pid=pg_backend_pid();

 pg_backend_pid |   host    |                          cmd
----------------+-----------+-------------------------------------------------------
        1127372 | 10.0.0.61 | postgres: franck yugabyte 152.67.90.247(45330) active
(1 row)
identification on the server
I have also displayed above the string that you should find in the command when you list the processes on the host, matching what you see from ps:
$

   ps -o cmd -p 1127372

CMD
postgres: franck yugabyte 152.67.90.247(45330) idle
My session was active when I ran the query and it is now idle waiting for the next command.
If you can't get the info from SQL, you can still find it by listing the PID with username, database name, client address and port:
$

   pgrep -a postgres | awk '
   /postgres: (.*) (.*) (.*)[(][0-9]+[)]/{sub(/ *$/,"");print}
   '

1038092 postgres: yugabyte yugabyte 152.67.90.247(42106) idle
1041807 postgres: yugabyte yugabyte 152.67.90.247(45638) idle
1127372 postgres: franck yugabyte 152.67.90.247(45330) idle
You can also get a list of all PostgreSQL pids with:
$

  pgrep -d, postgres

1031295,1031311,1031313,1031315,1031316,1031444,1031474,1031476,1031478,1031479,1031515,1031537,1031540,1031545,1031546,1038092,1041807,1127372
This is the same with YugabyteDB as the YSQL API uses the PostgreSQL backend.
You can also trace the latest connection to this host:
$

  pgrep -n postgres

1127372
strace
Here is my strace command, using $(pgrep -n postgres) to trace the latest connection, and using awk to calculate the elapsed time between network calls:
$

  strace -p $(pgrep -n postgres) \
  -e recvfrom,sendto -Ttttryys 100 -o /dev/stdout | awk '
  # keep last timing in t to show the difference
  t>0{T=$1-t}
  # recvfrom are after idle session, sendto are after active one
  {e="idle"}/sendto/{e="active"}
  # print time in second in front
  />, ".\\/{
   printf "%10.3f seconds %6s: %-s\n",T,e,$0;t=$1
  }
  # show stack if -k is used
  !/^ *>/{stack=""}
  /[(]PostgresMain[+]/{print "",stack" PostgresMain"}
  /^ *>/{sub(/.*[(]/," ");sub(/[+].*/,"");stack=$(NF-1)"<"stack}
  '
Explanation of the arguments:
-
-pis a comma separated list of PID(s) to attach to -
-e recvfrom,sendtotraces only the reads and writes to network syscalls -
-Tadds the syscall time at the end - not really useful here assendtoandrecvfromare just witing to write and read the buffer -
-tttadds the an absolute timestamp in seconds, which I use ca calculate the elapsed time betweensendtoandrecvfrom -
-rdoes the same but between two consecutive calls, useful if you trace more syscalls (to get more detail of the active session) -
-yyshows the socket information (TCP, origin, destination) -
-s 100shows 100 characters of the message, this may include the query, the parameters, the result...
You end it with Control-C
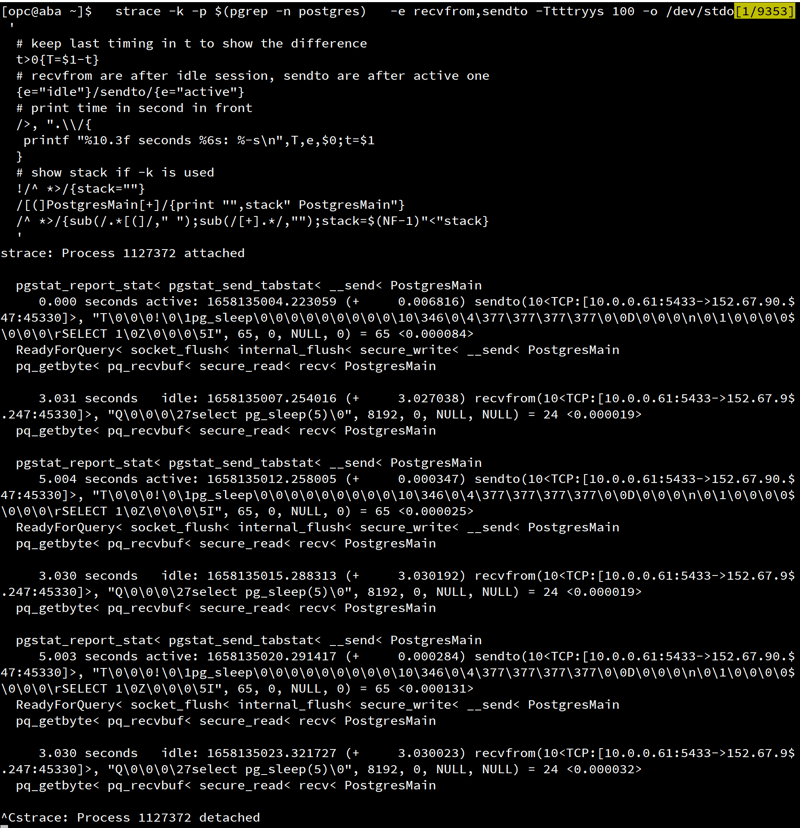
Here are my traces after running select pg_sleep(5)\watch 3:
strace: Process 1127372 attached
     0.000 seconds active: 1658132400.777489 (+     0.000401) sendto(10<TCP:[10.0.0.61:5433->152.67.90.247:45330]>, "T\0\0\0!\0\1pg_sleep\0\0\0\0\0\0\0\0\0\10\346\0\4\377\377\377\377\0\0D\0\0\0\n\0\1\0\0\0\0C\0\0\0\rSELECT 1\0Z\0\0\0\5I", 65, 0, NULL, 0) = 65 <0.000126>
     3.034 seconds   idle: 1658132403.811221 (+     3.032812) recvfrom(10<TCP:[10.0.0.61:5433->152.67.90.247:45330]>, "Q\0\0\0\27select pg_sleep(5)\0", 8192, 0, NULL, NULL) = 24 <0.000027>
     5.006 seconds active: 1658132408.817043 (+     0.000218) sendto(10<TCP:[10.0.0.61:5433->152.67.90.247:45330]>, "T\0\0\0!\0\1pg_sleep\0\0\0\0\0\0\0\0\0\10\346\0\4\377\377\377\377\0\0D\0\0\0\n\0\1\0\0\0\0C\0\0\0\rSELECT 1\0Z\0\0\0\5I", 65, 0, NULL, 0) = 65 <0.000174>
     3.033 seconds   idle: 1658132411.849789 (+     3.032513) recvfrom(10<TCP:[10.0.0.61:5433->152.67.90.247:45330]>, "Q\0\0\0\27select pg_sleep(5)\0", 8192, 0, NULL, NULL) = 24 <0.000028>
     5.005 seconds active: 1658132416.855284 (+     0.000219) sendto(10<TCP:[10.0.0.61:5433->152.67.90.247:45330]>, "T\0\0\0!\0\1pg_sleep\0\0\0\0\0\0\0\0\0\10\346\0\4\377\377\377\377\0\0D\0\0\0\n\0\1\0\0\0\0C\0\0\0\rSELECT 1\0Z\0\0\0\5I", 65, 0, NULL, 0) = 65 <0.000063>
     3.032 seconds   idle: 1658132419.887601 (+     3.032207) recvfrom(10<TCP:[10.0.0.61:5433->152.67.90.247:45330]>, "Q\0\0\0\27select pg_sleep(5)\0", 8192, 0, NULL, NULL) = 24 <0.000034>
     5.006 seconds active: 1658132424.893134 (+     0.000225) sendto(10<TCP:[10.0.0.61:5433->152.67.90.247:45330]>, "T\0\0\0!\0\1pg_sleep\0\0\0\0\0\0\0\0\0\10\346\0\4\377\377\377\377\0\0D\0\0\0\n\0\1\0\0\0\0C\0\0\0\rSELECT 1\0Z\0\0\0\5I", 65, 0, NULL, 0) = 65 <0.000143>
     3.031 seconds   idle: 1658132427.924617 (+     3.031141) recvfrom(10<TCP:[10.0.0.61:5433->152.67.90.247:45330]>, "Q\0\0\0\27select pg_sleep(5)\0", 8192, 0, NULL, NULL) = 24 <0.000043>
^Cstrace: Process 1127372 detached
You can see the session idle for 3 seconds, then receiving a call (Q is simple query) to pg_sleep and receives, after 5 seconds, the row (T is for row description)
Of course, you can run the same on the client side. Here is what I got at the same time with the same command except that the PID in -p is the psql one:
strace: Process 1915912 attached
     0.000 seconds   idle: 1658132400.793259 (+     0.000000) recvfrom(6<TCP:[10.0.3.176:45330->132.226.128.168:5433]>, "T\0\0\0!\0\1pg_sleep\0\0\0\0\0\0\0\0\0\10\346\0\4\377\377\377\377\0\0D\0\0\0\n\0\1\0\0\0\0C\0\0\0\rSELECT 1\0Z\0\0\0\5I", 16384, 0, NULL, NULL) = 65 <0.000049>
     3.005 seconds active: 1658132403.797932 (+     3.004631) sendto(6<TCP:[10.0.3.176:45330->132.226.128.168:5433]>, "Q\0\0\0\27select pg_sleep(5)\0", 24, MSG_NOSIGNAL, NULL, 0) = 24 <0.000070>
     5.034 seconds   idle: 1658132408.831439 (+     5.033590) recvfrom(6<TCP:[10.0.3.176:45330->132.226.128.168:5433]>, "T\0\0\0!\0\1pg_sleep\0\0\0\0\0\0\0\0\0\10\346\0\4\377\377\377\377\0\0D\0\0\0\n\0\1\0\0\0\0C\0\0\0\rSELECT 1\0Z\0\0\0\5I", 16384, 0, NULL, NULL) = 65 <0.000533>
     3.005 seconds active: 1658132411.836482 (+     3.004959) sendto(6<TCP:[10.0.3.176:45330->132.226.128.168:5433]>, "Q\0\0\0\27select pg_sleep(5)\0", 24, MSG_NOSIGNAL, NULL, 0) = 24 <0.000067>
     5.034 seconds   idle: 1658132416.870051 (+     5.033576) recvfrom(6<TCP:[10.0.3.176:45330->132.226.128.168:5433]>, "T\0\0\0!\0\1pg_sleep\0\0\0\0\0\0\0\0\0\10\346\0\4\377\377\377\377\0\0D\0\0\0\n\0\1\0\0\0\0C\0\0\0\rSELECT 1\0Z\0\0\0\5I", 16384, 0, NULL, NULL) = 65 <0.000118>
     3.004 seconds active: 1658132419.874207 (+     3.004159) sendto(6<TCP:[10.0.3.176:45330->132.226.128.168:5433]>, "Q\0\0\0\27select pg_sleep(5)\0", 24, MSG_NOSIGNAL, NULL, 0) = 24 <0.000135>
     5.033 seconds   idle: 1658132424.907636 (+     5.033427) recvfrom(6<TCP:[10.0.3.176:45330->132.226.128.168:5433]>, "T\0\0\0!\0\1pg_sleep\0\0\0\0\0\0\0\0\0\10\346\0\4\377\377\377\377\0\0D\0\0\0\n\0\1\0\0\0\0C\0\0\0\rSELECT 1\0Z\0\0\0\5I", 16384, 0, NULL, NULL) = 65 <0.000109>
^Cstrace: Process 1915912 detached
From the client, idle is the time where the database is active and vice versa. If the times do not match, look at your network.
strace can do a lot more, showing other syscalls, so that you have an equivalent of Oracle wait events to understand the non-CPU time. And if you add -k you can get the full call stack like this: