
In Part 1, we explored gender demographics among respondents of multiple surveys and the audiences of popular YouTubers, and saw that ratios of over 90% men were the norm.
Today in Part 2, we'll take a look at some other platforms and creators that are actually managing to be more inclusive – and see what they're doing differently.
Learning Platforms
Like we saw in Part 1, this article was prompted by noticing that Scrimba was an outlier in the survey results, with a much higher proportion of women users than similar platforms.

Because Scrimba used a special tracking tag when telling their members about the survey, I was also able to confirm that 23% of the respondents who came from Scrimba identify as women.
I reached out to Scrimba CEO Per Harald Borgen to get more data and ensure this result wasn't a fluke, and an ad-hoc poll conducted within the Scrimba platform directly revealed the same thing:
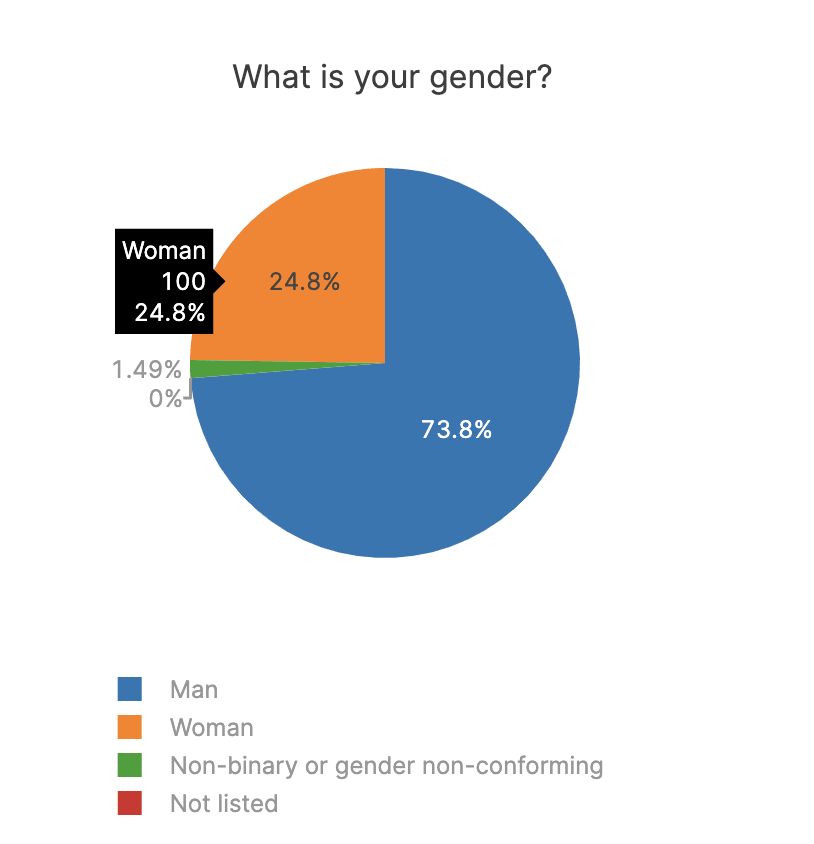
This was a pleasant surprise for Per. I asked if this was the result of a concerted effort or just a happy accident:
We have actively made our design and branding inclusive, but I wasn't aware of it having had this much impact before the State of JS survey.
This case study about the Scrimba redesign also outlines the team's thoughts about inclusivity at a design and branding level, and Per also told me they promote inclusivity through initiatives such as actively recruiting women as course creators and highlighting women's success stories.
But Scrimba is not the only platform that actively tries to be more inclusive. freeCodeCamp is a free platform with even more impressive demographics, with 36% female visitors:
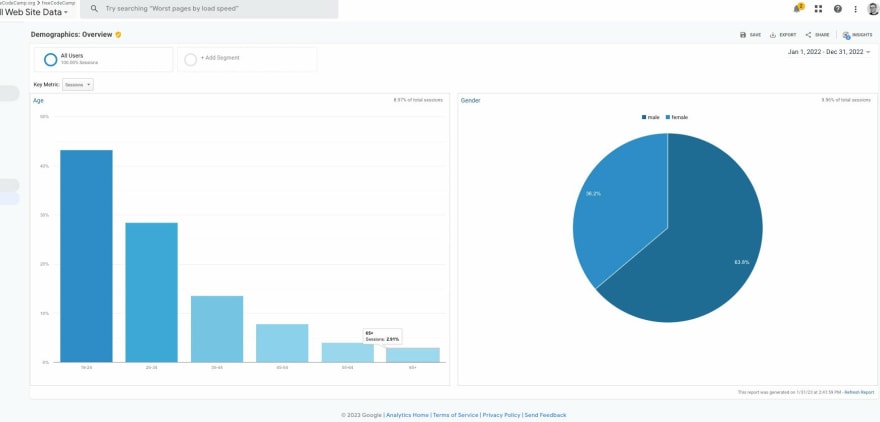
Once again, this is the result of a concerted effort to be more inclusive. As freeCodeCamp founder Quincy Larson told me:
Visitors to freeCodeCamp.org used to be about 20% female when we first started. That proportion has grown over the years, and for the year of 2022, was 36.2%.
We work very hard to cultivate an environment where people feel comfortable. That means a lot of moderation, and proactively seeking out feedback.
And while Josh Comeau didn't have hard stats to share, I found echoes of what both Per and Quincy told me in his approach to inclusivity:
I have been intentional about trying to keep the branding really friendly; I want the community I build to be really welcoming and inclusive.
There have been times where I've wondered if I'm maybe losing some people with the design [of the site]. But yeah, I figure I'd rather have a slightly smaller community of like-minded folks, rather than a larger one that isn't as friendly and empathetic.
The Importance of Messaging
This confirmed my own impression of Josh's approach. As an example, his latest course is entitled The Joy of React, and the word “joy” immediately struck me as much more inclusive than the typical naming schemes for programming courses – to the point where it almost seems out of place when talking about code!
This all points to the importance of being deliberate about the kind of community you build. Branding, content moderation, right down to your tone of voice or the vocabulary you choose to use all have a cumulative effect on the people you attract.
I don't always do a great job of this myself. As an example, current survey branding features light-on-dark themes that evoke programming terminals –because how else will people know this is a serious programming survey for the hardcore programmers?
But of course, this might in turn scare away beginners, who are by definition not "hardcore programmers" yet – and as we saw that also happens to be the most diverse segment of State of JS respondents. Moreover, the “glowing terminal” aesthetic itself can be seen as a throwback to an era of programming where inclusivity was the last thing on anybody's mind.
So is it possible that my attempts at courting one segment of the population are simultaneously pushing away another?
Multiple Funnels
We know that women represent 50% of the general population, but within the segment of the developer community that participates in the State of JavaScript survey and fills out their gender, that proportion drops to only 5%.
Between those two datapoints, there are multiple funnels that keep making that ratio smaller and smaller.
Using the U.S. as a baseline, while some stats point to 28.7% of software programmers being women, according to Wikipedia, “fewer than 12% of computer science bachelor's degrees were awarded to women at U.S. PhD-granting institutions in 2011.”
Then take that number, and remove all the women developers who do not engage online for a number of reasons (harassment, lack of representation, not feeling like they belong, etc.), and you end up with a yet again smaller slice of the pie – and one that's especially tricky to measure.
Similarweb suggests that the very website you're reading this on has a 22% female audience – but as is often the case with gender stats, without more transparency about the methodology employed it's hard to know how much to trust this data.

And finally, it's worth asking if the JavaScript community itself is somehow turning women away. Although I couldn't find many other equivalent datapoints to compare the JavaScript ecosystem to, I did notice that female respondents made up 21% of WordPress developers in 2020, a much better ratio.

At the end of the day, my own limited research wasn't enough to determine which funnel is responsible for the biggest drop-off. But if you have your own theories do let me know!
Takeaways
At the end of the day, I can boil down what I've learned throughout this whole process to four things:
First, the status quo of the developer community is very male-oriented, not only in terms of demographics but also in terms of vocabulary, branding, and more. Changing that will take some deliberate action in the opposite direction, not just staying neutral.
Second, few people are actually tracking these issues in a transparent and reliable manner, and it's hard to improve what you don't track. We shouldn't be happy to merely adopt the language of inclusivity if we're not also keeping ourselves accountable to see if our efforts are effective or not.
Third, an effective way to diversify your audience is to make more beginner-friendly content, as that segment of the population is the most diverse one.
Fourth, even with the best intentions, it's really hard to break out of your own bubble. We naturally tend to attract an audience who looks, talks, and thinks like us, which is why it's so important to involve people who aren't like us every step of the way to counteract this natural tendency.
Next Steps for the Surveys
I think there's a lot in here that I can apply to the State of JS and State of CSS surveys:
- I need to keep making sure women are involved throughout the survey design process. Google's support let us hire Lea Verou to help design the 2022 State of CSS survey, and I hope to find someone equally awesome to fill her shoes for the 2023 edition!
- I suspect the surveys are not currently beginner-friendly enough. For example, as a TypeScript novice myself I'm not sure I would feel qualified to take a "State of TypeScript" survey. How can we change this?
- As I mentioned, I will improve the process for deciding what resources are featured in the survey.
Further Resources
If you want to learn more about this topic, here are some good resources:
- Code: Debugging the Gender Gap on Prime Video
- Inclusive Design Communities by Sameera Kapila
Breaking Through
I am under no illusion that this post will by itself have a meaningful effect on the situation.
But I do hope that if it gains enough traction, it can help me break through my own little male-dominated bubble, and land on the doorstep of the people who are most directly impacted by our community's lack of inclusivity – and as a result often the hardest to reach.
If that's you, and if you think what I'm doing here is valuable, then leave a comment here – or maybe even join our Discord.
Or maybe you're a woman or non-binary person who creates programming content and you have your own demographics data to share – in which case get in touch and let's start working on a follow-up post!
And at the risk of appearing self-serving, you might also consider participating in an upcoming State of JS or State of CSS survey to help us diversify our audience.
In any case, thanks for making it to the end of this post – but hopefully the beginning of an important conversation!
Cover image created using Chromata by Michael Bromley.
Thanks to Jeff Delaney, Kyle Cook, Jack Herrington, Jess Chan, Nicole Hiller, Per Harald Borgen, Wes Bos, Kent C. Dodds, Quincy Larson and Josh Comeau for being willing to share their data and feedback.
And huge thanks to Martin Heidegger, Stephanie Tuerk, Jess Chan, Sameera Kapila, and Sophonie Bazile for reviewing drafts of this posts.